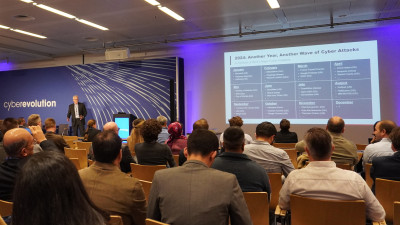
My goal is to use the next 21 is to make you stop trusting your UBA solutions or well, at least stop to, to trust them blindly. And, but what makes me more skeptical about these algorithms or these kind of solutions is that well, I've been there doing them. I've been then creating them with one identity. We've been in the privilege, access management and identity management space for almost two decades. I've been doing that for 10 years out of that, I've been working on UBA solutions for the last, roughly five years.
I've launched one from scratch and all that experience made me really skeptical about what algorithms can achieve and how we need to approach algorithms. Don't get me wrong. We can get fantastic results. We just must not as Americans say during the Kool-Aid, we need to be careful about what we believe about different algorithms.
So I hope Mr. Kuppinger won't kick me out of this conference for bringing up a, a Gartner charter, but I think their hype cycle summarizes pretty well.
What goes on with every technology out there, and this is the same thing that happened with UBA or, well, any kind of intelligence in security. If you went to a trade show five years ago to, to RSA or, or anything out there, every single window had machine learning intelligence, the, the next generational security plastered all over their booth. They couldn't stop talking about analytics and we couldn't tie there.
I mean, that was the time we jumped onto the bandwagon and started investing heavily in security analytics. And we very quickly reached the, the, that the peak of inflated expectations. When we thought that this is the, this is the next technology that could solve all of our problems.
But I think since then we became more realistic. We went through that, that, that the valley of this illusion land. But I think we are now with these technologies quite close to that plateau of productivity, we started to figure out the, the role and the place of these technologies in our, our security posture.
But that requires us to be able to realistically measure how well these solutions protect us, how well these solutions work, not just on paper, not just in theory, not just in the white papers of vendors, rather either or organization in our technology environment, on our data. So we basically need to figure out whether we can trust behavior analysis, whether we can trust these, these algorithms, these solutions. So behavior analysis tools make a bold claim. Eventually all of them say we want to prevent data breaches. That's the goal. That's what we say on our product page as well.
That's the goal, but that's a pretty bold claim to make preventing data breaches takes a lot of F for it. And it is, it can be really problematic. Now the big problem is, is what our lead data scientist does not fail to say every single week without data, you cannot do science and getting high quality and large amount of data about data breaches about attacks is a real difficult thing. There is no such thing as a authority repository of, of data breaches, people who get breached rarely publicized data about how that happens.
Sometimes they do post more attempts and, and those make for really good reading. You can learn a lot out of them, but very few of them actually publish data dumps that you can analyze. And even if they do it is very rarely in a format that you could readily use in your same solution in your data science tools.
It's a different format. It's a different setting. It's been anonymized to protect the intellectual property of those companies. They're very hard to use.
So that's, it's not a really good solution. And also the other problem is is that even if you had that data analyzing data done, thus that were created in the past will not guarantee that you will be able to, or the solution we'll be able to protect you from data breaches or attacks that are happening in the future because attackers will evolve. New attack techniques will emerge. The software that you're using for defense will change, and that changes the landscape. So sum it up. That's the big problem of dealing with behavior analytics or, or security analytics altogether.
There are no known a samples. There are some representatives out there. You can do tricks to collect that kind of data, but it's not like for example, in other industries, in, in healthcare where you have these huge data records that you can analyze, you just simply don't have that.
So, but there's a trick that you can use. And there's a pretty efficient trick that that will help you there. And it is using the data that you already have.
What, even though we don't really have data repositories of attacks, what we do have is terabytes and terabytes of data of, of what's going on in, in our organizations. We have a lot of data about business as usual happenings about what our users are doing in our systems every single day. So we could use that same data to, to test our algorithms instead of waiting for an attack to happen. Instead of waiting for an attacker to actually breach our system, which happily is a rare occasion, we could just use the data we already have and test our systems or security systems using that data.
The basic idea is, is quite simple. It is called cross scoring.
And in principle, it's, it's a really simple thing, but it will become a really, really powerful tool to assess the quality of these solutions. So the first step is to take some data from your system. It does not have to contain any kind of attack samples. You should just take a sample of LS, Bob and Charlie, doing what they do every single day. Those little faces represent Elise, Bob and Charlie. And those little shapes are their activities.
You should split those activities into two portions, and you could use the first portion as a, as a training period. And the second portion as, as a test period, this is a quite typical thing to do when you're dealing with algorithms.
Now, the next step is to use the algorithm that you want to test, use the solution that you want to test use the behavior analysis solution that you want to test to build a baseline, using the data in the testing period.
You should build baseline for LS and Bob and Charlie as well. Now the next step is to compare activities in the test period to the baseline. If the algorithm is working well, if that behavior analysis solution is working well, you expect analysis activities to be scored as, as pretty normal, as pretty business.
As usual, when you compare it to analysis baseline, the same thing. You'd expect Bob's activities to be pretty low, to get a pretty low score when you compare them to Bob's baseline and the same thing should happen for Charlie. But when you start comparing Ellis's activities to Bob's baseline or visa versa, when you compare Charlie's activities to Bob's baseline and visa versa, you expect a score to be higher, because what you did right there is that you simulated an attack. You simulated Bob hijacking Charlie's account.
You simulated Ellie's hijacking Bob's account by comparing Alice's activities to Bob's baseline. You basically got your hands on some attack data because those accounts in that case have been hijacked by people within your own organization.
Okay? The basic principle is, is quite simple, but how can you use that? How can you use those score to actually figure out whether it is algorithm is working well, you can apply the same principle to, to basically any kind of algorithm that you would use. In that case.
You could use the same principle to assess algorithms that learn when a user is typically active, what kind of applications they're using, what kind of data points they're accessing, what kind of biometric attributes they have, how are they typing? How are they using their, their mouse, which is their physical location, what is their physical location? And you get those scores and you need to figure out whether those scores are good or not. The first and easier solution is just eyeballing the data.
The basic tool for that is something called a histogram.
I think most of you have seen charts like that, but, but I just go through the, the basic idea behind that the horizontal scale shows the score that algorithm gave to, to give activity. So scores on the left hand side mean that the activity was business as normal. It was perfectly usual. The algorithm said that this is what this person is doing. LS is doing what LS is normally doing. Whereas activities that got the score of a hundred activities that are on the right hand side of D chart are what the given algorithm thought to be highly unusual.
Alexei is usually working in the middle of the day. Now it is in the middle of the night.
He's, she's typing in a different way, those kind of things. And the vertical axis of this chart shows how many activities got that given score.
Now, using that approach, you can assemble this, this chart and you could label the, assigned these activities into different groups. So in that chart, what you can see is that the own activities of S what we know to be usual guest court pretty low. Those are the blue activities. Most of the activities that were done by Ellie got a score between 20 and 40.
Now, most of the activities that we know are unusual, got a pretty high score around 80 there's that peak around 80. So looking at this chart, you can see that, well, most algorithms that should have been, or most activities that should have been categorized as low, where indeed categorized as, as business is normal. Whereas most activities that we know should have been categorized as unusual, very indeed categorized as unusual. So this algorithm seems to be doing its job.
Now here's another example, another algorithm, which categorized normal activities, even lower.
It almost all of the activities that we know are normal, got a score at around 10, for example, whereas activities that were introduced as unusual indeed got pretty high scores. So this algorithm seems to be even better, but here's an algorithm that is not performing that well, because as you can see the activities that should have gotten low scores got pretty high scores. Those are the blue ones that are, that can be seen all the way to the right, whereas normal activities that should have gotten quite low scores got, got pretty high scores.
So in case of this algorithm, we even, would've been better off if you just SW the scores. So this algorithm is not performing well. Okay. It's a pretty good thing to, to be able to look at these charts and then quickly figure out if the algorithm or the behavior analysis solution is doing its job, but it's always better to, to quantify things.
It's, it'd be really good. If we could associate a number where with how well a given algorithm works on our data set, there's a very widely used metric called AUC, which stands for area on the curve, on the receiver operator, characteristics charts. It's a really simple figure. I won't have time to go into details about that, but just look it up on this Wikipedia page. But what it basically does is that it quantifies these results. For example, 40 algorithm that I, I showed on the first chart, the AUC score we could calculate was point 86, which is pretty good.
And here you can see how the AUC score changes. As, as the chart changes, you can see that algorithms that are able to separate known good behavior from known bad behavior, get a, an AUC score of 1.0. Whereas algorithms are unable to do that. Get a much lower score down to even the zero for algorithms that get it completely wrong,
But we can do much more with numbers. Just these simple data points. Remember the basic thing that we did is that we built a baseline for SBO and Charlie, and we compare the activities of SBO and Charlie to their own and to the others' baseline.
We could use this game, same scores to, to come up with a lot of tons of more metrics. I won't go through all of them, but I, I just mentioned some, for example, the, the one we use quite frequently is called P AUC, which is an extension of the AUC, which tells us how much a given algorithm or a solution is able to separate from foe.
Even if, because even if an algorithm is capable of separating all bad activities from all good activities, we want that algorithm to be sure in, in, in its assessment, we want the good activities to get a score of zero.
We want the bad activities to get a score of 100, as opposed to getting 45 and, and 60. And this is what the, the metric called P a U C quantifies. If an algorithm is capable of giving a score of 100 to, to the attacker and the score of zero to, to business as normal activities, then it's P AUC score is going to be quite high.
But I think throughout the last couple of years, we developed roughly a dozen different metrics that help us quantify the algorithms that we test and try. And you can go to the, to the blog for data science team, to, to learn much more about them. Some of those are used have been in use in, in different data science projects for last decade or so, others are quite specific to this domain of behavior analysis and we sort of developed, developed them. So I'd just like to leave you with a few key thoughts with a few basic ideas.
First, just don't trust algorithms, blindly, the more complex, the more pop popular an algorithm is, the more skeptical you should be. If you don't understand what an algorithm is doing, just test it, try to learn more about that, but also use the algorithm, use that solution on your own data and verify if it can be useful for you. Without that, you're just G guessing basically you're gambling.
You could try looking for real life, usable data samples of attacks. If you do that, I'm ready to pay a huge amount of money for that.
I, I really do, or at least buy you an infinite amount of beer or vine or whatever is your poison. It's a very hard thing to do. You could come off with samples and you should come off with samples. You should try to do penetration testing within your organization while these tools are in operation, but looking for a historical data dump of large quantities and good quality is, is I think a fool's errand. It's it just, you just cannot find it out there. And this simple trick, what I showed you, this, this trick called cross coring can do wonders. It's extremely useful.
It gives you a lot of data that you can use that can help you quantify a lot of different metrics about all of these solutions at all of these algorithms. Thank you very much.
Thank you, Peter. And I hope you still have time for a few.


